


| SOURCE |
Snaps
sentry
sentry is simple and basic client. It shows current image.
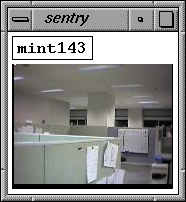
sfview
sfview shows recent images from several channels. User can compare several images and guess what happend.
Window of sfview is splitted 3 parts. Top sub window shows image frames according to the time line (left to right). You can recognize what images are received at the time.
Center subwindow depicts relationship among frames. A single blue point means existance of frame. To save screen space, only one point is plotted when multipul frames are exist. In below snapshot, two horizontal lines are drawed. These lines mean 'sfview scanned images from 2 channels'. A grey vertical line is plotted at 00 seconds of every minitus. At last, a red vertical line means focus point.
Bottom subwindow shows the distribution of frames in relative long term view. Each cell project an hour of days. The color of cell shows several meaning. Gray is unavailable. White is available but empty. Cyan means existance of many frames.
 Produce by Sentry Team, NAIST. Aug 2002.