This page was created by the Report Generator tool,
a part of the Web Polygraph
performance benchmark.
1. Executive summary
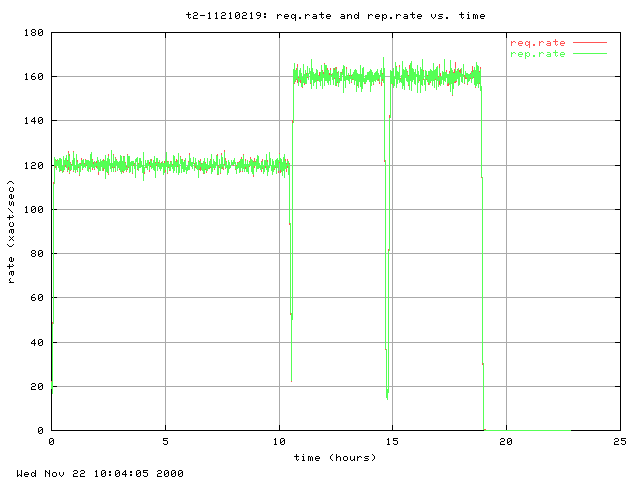
| Throughput: | 135.44 | rep/sec |
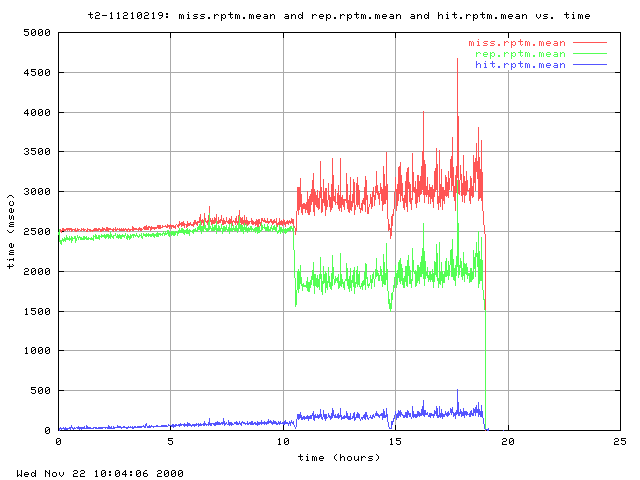
| Response time: | 2202.94 | msec |
| - misses: | 2712.16 | msec |
| - hits: | 176.77 | msec |
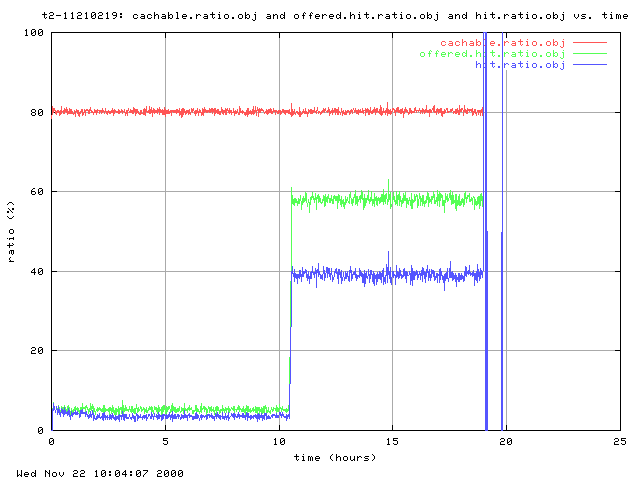
| Hit Ratio: | 19.46 | % |
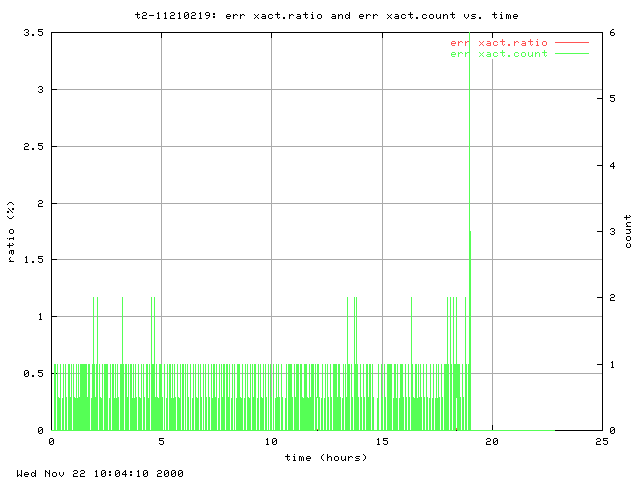
| Errors: | 0.00 | % |
| Duration: | 18.93 | hour |
Phases: framp|fill|fexit|inc1|top1|dec1|idle|inc2|top2|dec2
2. Engineer summary
1.00 logs
were used to generate this report.
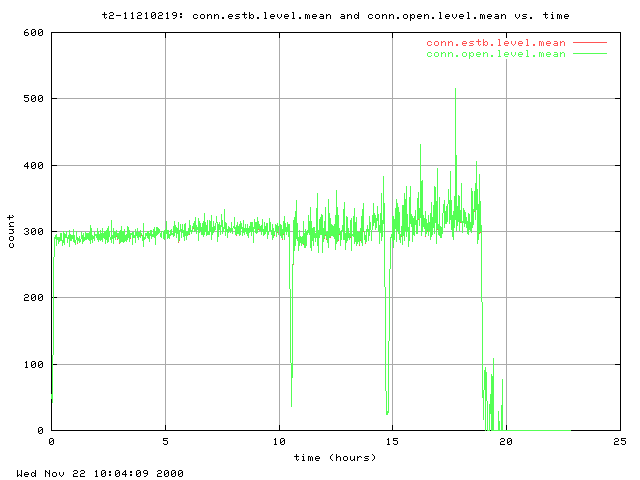
| Load |
Count
(xact/sec) |
Volume
(MBits/sec) |
| Offered: |
135.44 |
11.53 |
| Measured: |
135.44 |
11.53 |
| Hit Ratios |
DHR
(%) |
BHR
(%) |
| Offered: |
28.79 |
30.16 |
| Measured: |
19.46 |
17.49 |
| Cachability Ratios |
Count
(%) |
Volume
(%) |
| Measured: |
80.14 |
83.65 |
| Response Times |
Response Time (msec) |
| Min |
Median |
Mean |
Max |
| hit |
0.00 |
88.50 |
176.77 |
14876.00 |
| miss |
4.00 |
2667.50 |
2712.16 |
57531.00 |
| ims.sc200 |
1.00 |
1941.50 |
1917.45 |
39180.00 |
| ims.sc304 |
4.00 |
2715.50 |
2747.59 |
82444.00 |
| cachable |
0.00 |
|
2109.85 |
57531.00 |
| uncachable |
4.00 |
|
2658.67 |
50577.00 |
| fill |
4.00 |
|
2729.67 |
57531.00 |
| basic |
0.00 |
2339.50 |
2218.86 |
57531.00 |
| ims |
1.00 |
1979.50 |
1935.77 |
82444.00 |
| reload |
4.00 |
2755.50 |
2783.73 |
22195.00 |
| rep |
0.00 |
2327.50 |
2202.94 |
82444.00 |
| Wait Queue |
requests |
| Enqueued: | 3825785.00 |
| Dequeued: | 3825796.00 |
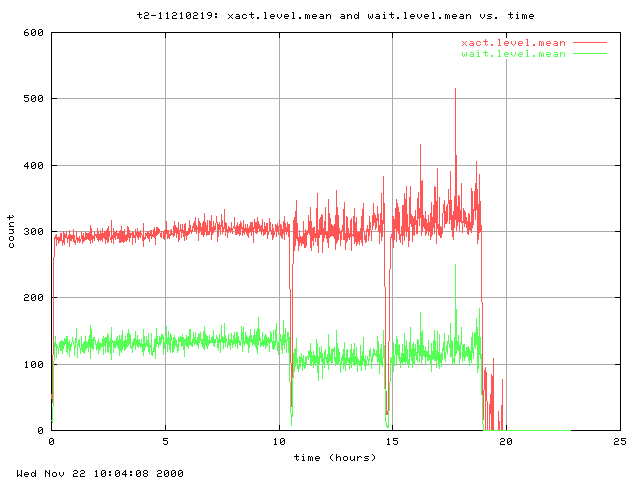
| Average length: | 126.04 |
| Stream Rates |
Count
(rep/sec) |
Volume
(MB/sec) |
| hit |
26.36 |
2.02 |
| miss |
109.08 |
9.52 |
| ims.sc200 |
14.84 |
1.27 |
| ims.sc304 |
0.33 |
0.00 |
| cachable |
108.54 |
9.65 |
| uncachable |
26.90 |
1.89 |
| fill |
70.68 |
6.58 |
| basic |
116.47 |
9.94 |
| ims |
15.18 |
1.27 |
| reload |
3.79 |
0.33 |
| rep |
135.44 |
11.53 |
| Stream Totals |
Count
(rep*106) |
Volume
(GByte) |
| hit |
1.54 |
14.45 |
| miss |
6.39 |
68.20 |
| ims.sc200 |
1.01 |
10.54 |
| ims.sc304 |
0.02 |
0.00 |
| cachable |
6.36 |
69.14 |
| uncachable |
1.58 |
13.52 |
| fill |
4.82 |
54.69 |
| basic |
7.94 |
82.65 |
| ims |
1.03 |
10.54 |
| reload |
0.26 |
2.72 |
| rep |
9.23 |
95.91 |
| Connection Length |
Min |
Mean |
Max |
| Use (xact/conn) |
1.00 |
1.00 |
1.00 |
| Life time (msec) |
0.00 |
2202.94 |
82444.00 |
| Object Sizes |
Size (KB) |
| Min |
Median |
Mean |
Max |
| hit |
1.25 |
5.62 |
9.82 |
363.51 |
| miss |
0.38 |
5.09 |
11.19 |
4703.71 |
| ims.sc200 |
0.38 |
5.20 |
10.93 |
2968.44 |
| ims.sc304 |
0.10 |
0.10 |
0.10 |
0.10 |
| cachable |
1.25 |
|
11.40 |
4641.71 |
| uncachable |
0.38 |
|
8.99 |
4703.71 |
| fill |
1.25 |
|
11.91 |
4641.71 |
| basic |
0.38 |
5.21 |
10.92 |
4703.71 |
| ims |
0.10 |
5.02 |
10.69 |
2968.44 |
| reload |
0.39 |
5.19 |
11.04 |
3308.82 |
| rep |
0.10 |
5.19 |
10.90 |
4703.71 |
| Object Class |
Contribution (%) |
| Count |
Volume |
| hit |
19.46 |
17.49 |
| miss |
80.54 |
82.51 |
| ims.sc200 |
10.96 |
10.99 |
| ims.sc304 |
0.25 |
0.00 |
| cachable |
80.14 |
83.65 |
| uncachable |
19.86 |
16.35 |
| fill |
52.18 |
57.02 |
| basic |
86.00 |
86.18 |
| ims |
11.21 |
10.99 |
| reload |
2.80 |
2.83 |
| rep |
100.00 |
100.00 |
Errors (0.00% of all transactions):
#errno  count count% explanation
   263     65  26.10 "premature end of msg body"
   267    152  61.04 "unsupported HTTP status code"
   276     32  12.85 "hit on reload request"
Potential problems:
- Measured document hit ratio (19.46%) differs
from the offered DHR (28.79%)
by -32.41%.
- Measured byte hit ratio (17.49%) differs
from the offered BHR (30.16%)
by -42.01%.
- Reported fill count contribution (52.18%)
does not match `cachable miss' estimation (60.68%).
- Reported fill volume contribution (57.02%)
does not match `cachable miss' estimation (66.16%).
- ... where A differs from B by X% means X = 100*(A-B)/B.
3. Traces
Generated on Wed Nov 22 10:04:10 2000 by ./make_report t2-11210219